


Displaying Wind Data
In this post we discuss the following topics
- Displaying vectors using its X/Y components
- Computing magnitude and direction using GRASS
Using advanced symbology in QGIS
Introduction
Meteorological conditions of any location at a given time are a function of many variables such as atmospheric temperature, relative humidity, pressure and mainly the wind parameter.
This wind parameter and its pattern determine most of the significant weather phenomena that occur around the world everyday from small wind gusts to the setting of monsoon. Wind satisfies the conditions of vector quantity as it has both magnitude and direction, which varies according to the location, season and also the altitude.
Wind being one of the main components of weather is difficult to acquire for a particular region let alone the whole world. Wind data is mostly available in a gridded format with values of X, Y accompanied by wind vector data. These data are generally very difficult to process without the help of some software, which is generally the case for most meteorological departments all over the world. Meteorological departments generally prefer software for time series analysis (to compare historical data) such as GrADS. Hence GIS software are not widely used or preferred by Met departments for processing the wind data.
GIS toos provide a lot more features and tools to process and analyse wind data. These datasets are useful in site suitability studies, fire management and many other fields where the prevaling weather is an important factor in modeling.
Wind Direction and Magnitude
For most of the meteorological purposes, wind data is measured in terms of its orthogonal components i.e U (East-West) and V (North-South) components of the Wind. These can be used to calculate the wind direction and magnitude by using simple trigonometric functions.
Data Needed
The following data are needed to accomplish the task.
- Source: ftp://ftp.cdc.noaa.gov/Datasets/ncep.reanalysis/surface/
U component of the wind (Netcdf format) Wind Data U component from http://www.esrl.noaa.gov/psd
V component of the wind (Netcdf format) Wind Data V component from http://www.esrl.noaa.gov/psd
Wind Direction and Magnitude Calculation using QGIS and GRASS GIS
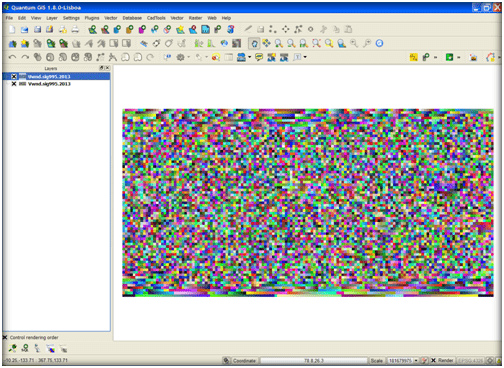
1.Load Netcdf File (Add raster data – Open the netcdf files)
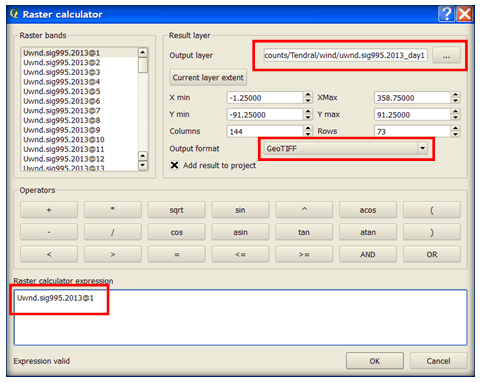
2.Convert each Band to single raster through raster calculator (If multiple bands are there)
3.A grass database and new location (import proj information from converted tif files) is created at the outset.
4.U and V data in then imported into GRASS database
- Following formula is used to calculate the magnitude –
-
- mag = sqrt( u * u + v * v )
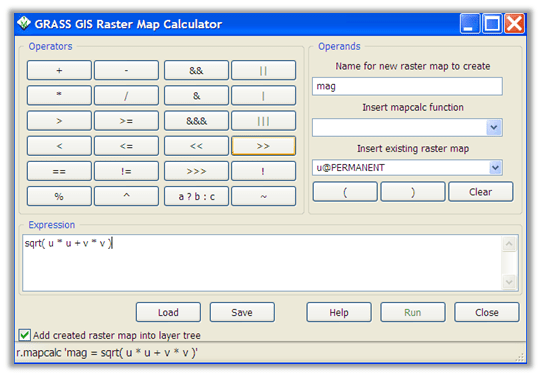
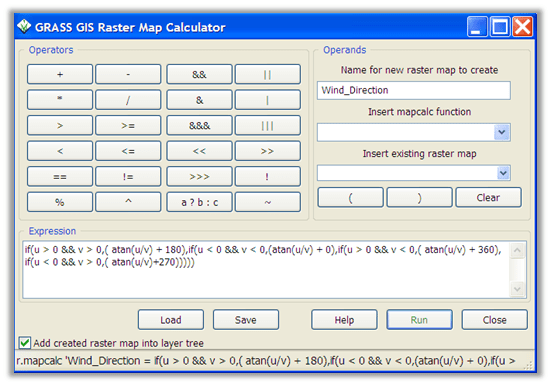
- Formula used in GRASS raster calc window
-
- if(u > 0 && v > 0,( atan(u/v) + 180),if(u < 0 && v < 0,(atan(u/v) + 0),if(u > 0 && v < 0,( atan(u/v) + 360), if(u < 0 && v > 0,( atan(u/v)+270)))))
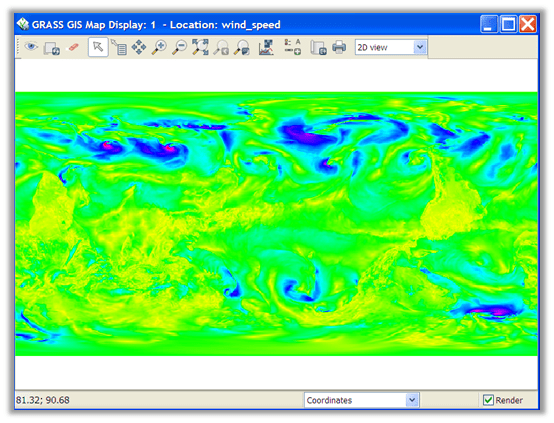
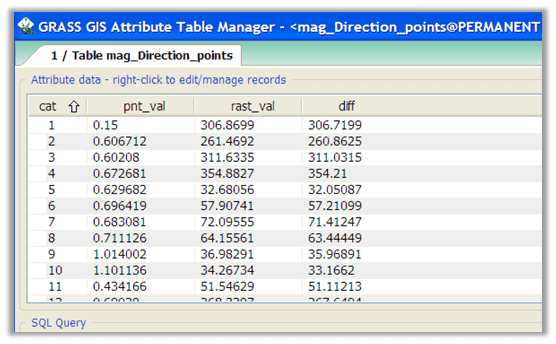
- Magnitude of the raster map is converted into magnitude vector points which holds the magnitude column which can be used later to fix the size of the arrows
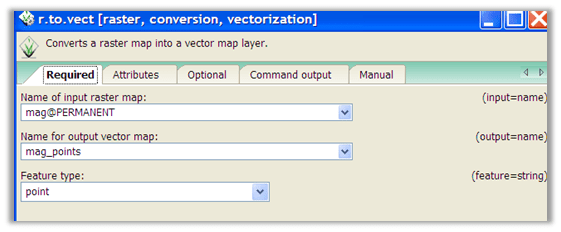
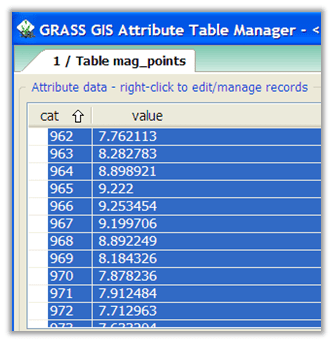
Value column holds the magnitude value
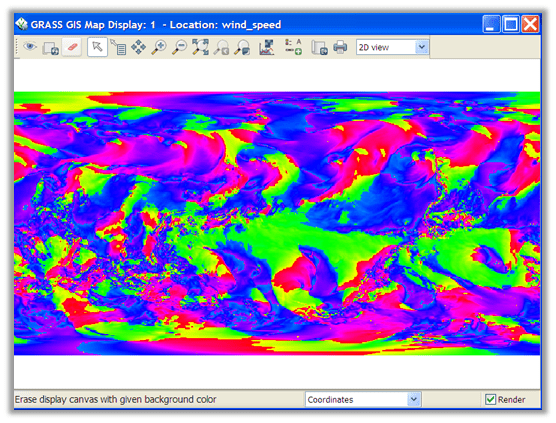
- Direction component from direction raster is converted to vector points
- v.sample option is used to transfer raster attributes to points
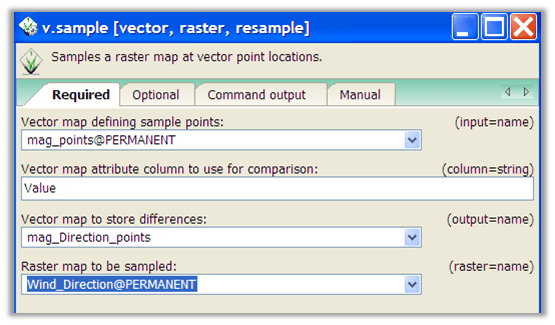
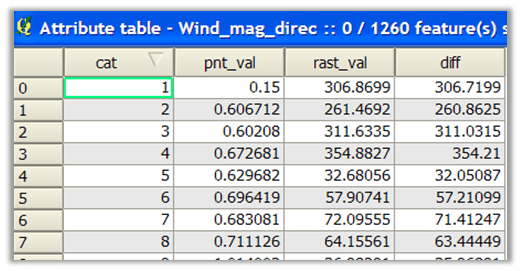
“pnt_val” – magnitude values and “rast_val” holds the direction values
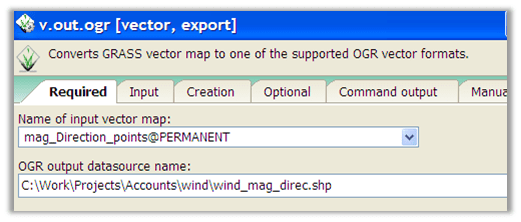
- Resulting vector which holds both direction and magnitude is then exported as shapefile
Viewing data in QGIS
- Vector file with direction and magnitude values is then loaded
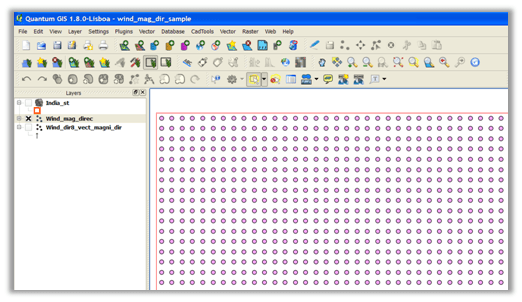
- Properties can be changed in style tab ( right click on the vector layer → properties)
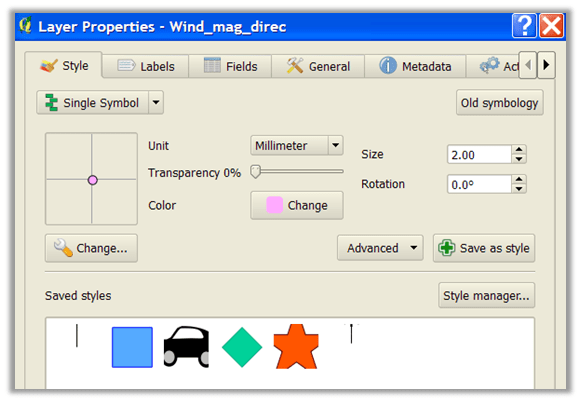
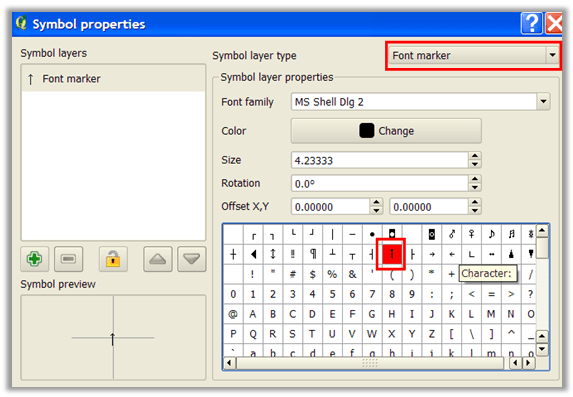
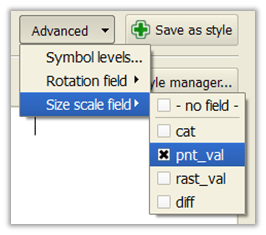
- “Change button” is used to then choose the option as shown in figure below
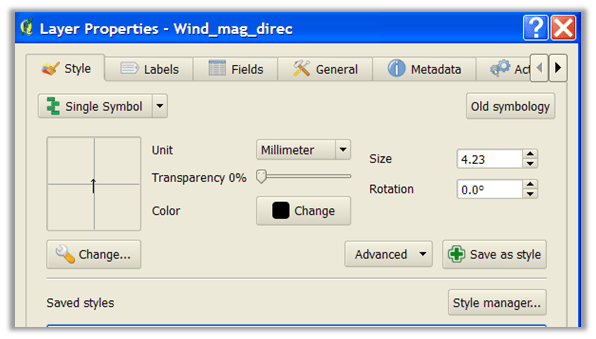
- Setting up size and rotation fields is completed by going back to the style tab to choose the following options
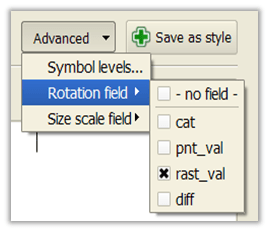
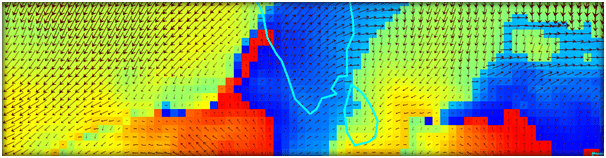
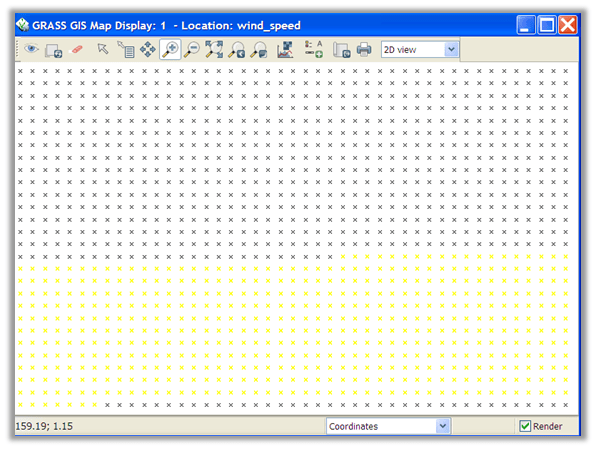
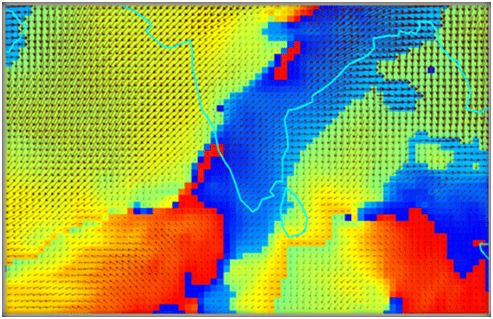
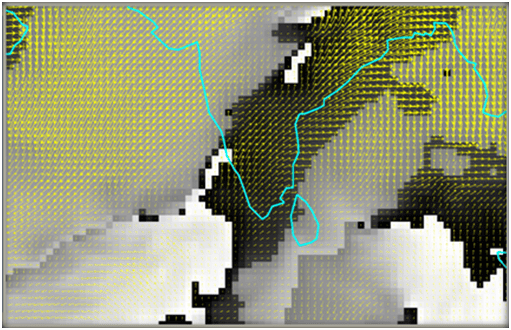
- The resultant figure obtained in QGIS after the following processes will depict the wind vector (direction along with magnitude).
Leave a comment