


Global Summary Of the Day (GSOD) Data Preparation
Introduction
Weather information is relevant in many application areas. There are many sources of weather data starting with the daily news. In this article, we describe a process to get global weather data in a GIS format which can be integrated with other datasets. We have used this data in modeling crop yields.
GSOD Data
The NOAA link which provides GSOD data isftp.ncdc.noaa.gov/pub/data/gsod/. From this link the required station and its Met parameters for a whole year could be downloaded. For example if the year 2013 is chosen then the link ftp.ncdc.noaa.gov/pub/data/gsod/2013/ . Each file in this website represents a single location in a gzip compression. The entire data for all the station is available in single compressed file (.tar).
Data Category: Weather – Land surface weather observations.
GSOD Location Shape File
1. The location details of these sites were obtained from the site https://sites.google.com/site/moyhudocs/documents which contains a file GSOD.kmz.
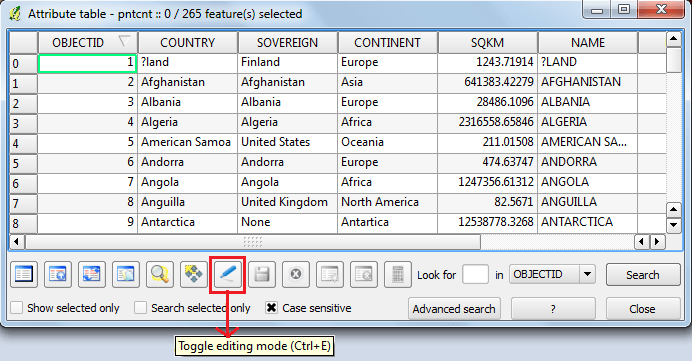
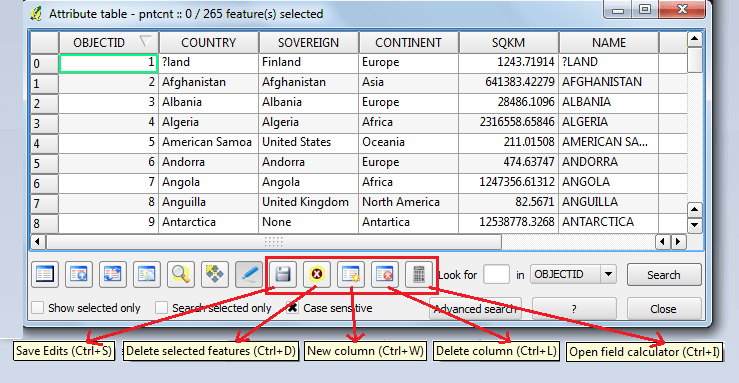
2. Download this file, extract it and open the extracted Keyhole Markup Language (.kml) file using Quantum GIS. Open attribute table of this file to view the contents which consists of all the site details.
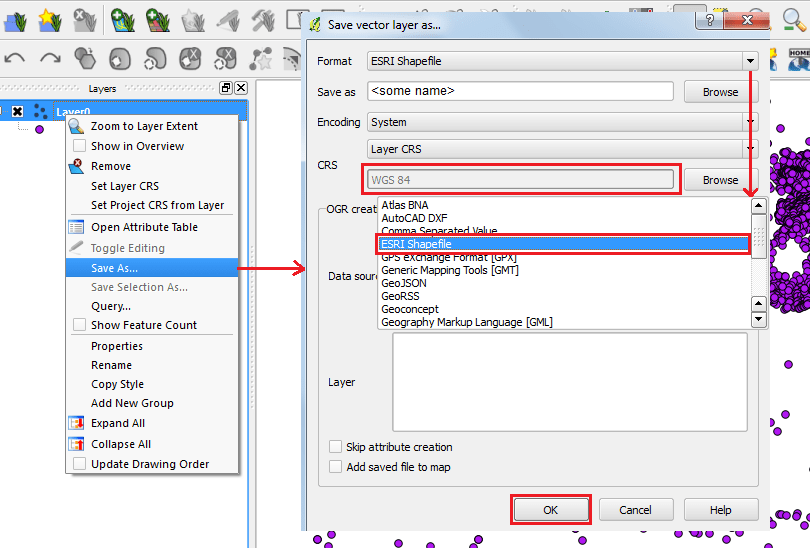
Save the file in ESRI shapefile format with WGS84 coordinate system. Open the saved shape file and edit the attribute table content to the required specifications by clicking ‘Toggle editing tool’ button. This opens various tools which can be used to edit the table content.
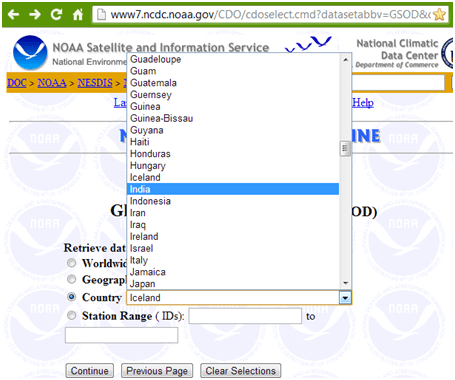
3. Also edit the location IDs which have error, this can be checked with the location IDs that are present in the site http://www7.ncdc.noaa.gov/CDO/cdoselect.cmd?datasetabbv=GSOD &countryabbv=&georegionabbv= for each location by choosing the respective country.
GSOD Data Integration
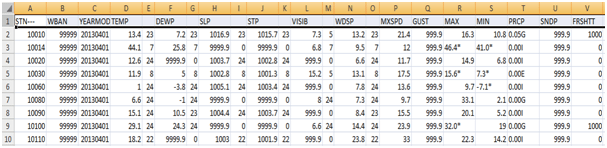
1. Open the GSOD sites shapefile along with the downloaded weather parameters (.txt/.op converted to .csv) file which contains all the station’s respective data in Quantum GIS. The table will appear in the QGIS workspace.
2. Double-click on the shape file in the QGIS workspace to open the properties dialog box, go to ‘Joins’ tab.
3. Click on the ‘+’ button to open ‘Add vector join’ dialog box in which choose the fields to merge and click OK.
Data QA/QC
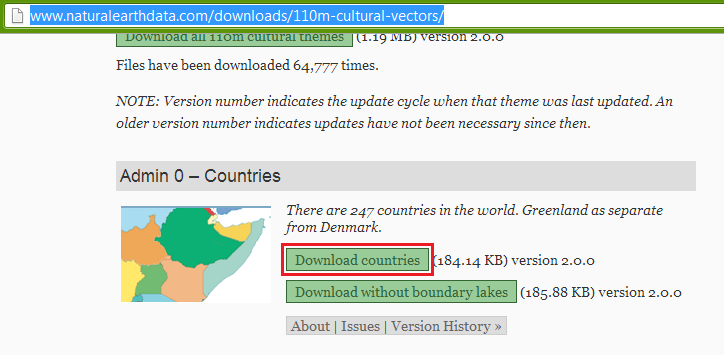
When we are dealing with a large volume of data it is essential that we set up a process for error checking and ultimately error removal. At a minimum we need to get a summary of the number of data points within each country. This requires the global country boundaries shape file which can be obtained from http://www.naturalearthdata.com/downloads/110m-cultural-vectors/
.
1. Open the Country boundaries shape file in Quantum GIS, the attribute table of this shapefile contains some unwanted fields for the following process, which can be deleted by activating the set of editor tools mentioned above.
– Downloaded countries boundary does not include POK and COK as Indian boundary which too was edited, this file can be downloaded from here.
2. Open the GSOD sites shapefile in the existing Quantum GIS workspace.
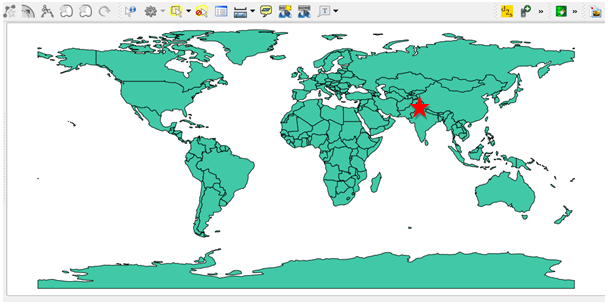
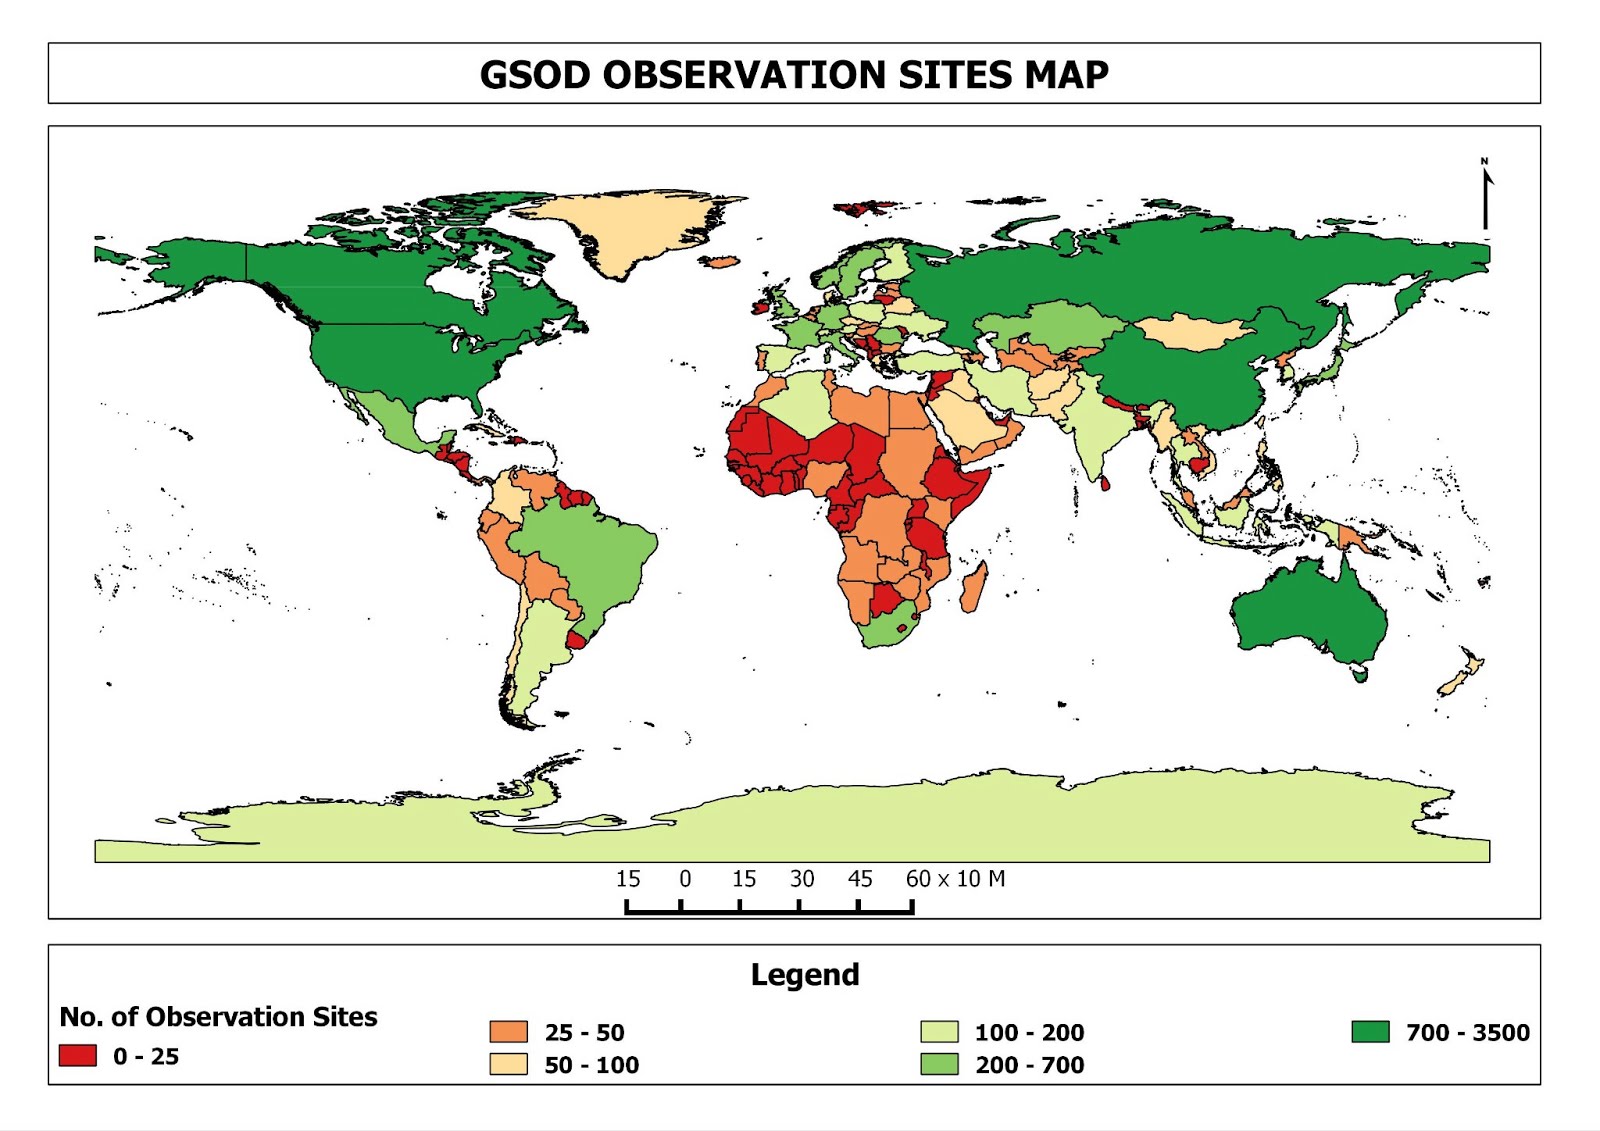
3. Go to Quantum GIS menu bar and click ‘vector’ menu from which choose ‘Analysis tools’ and select ‘Points in polygon’ feature. Provide the output count field name and the destination of the output file and then click ok.
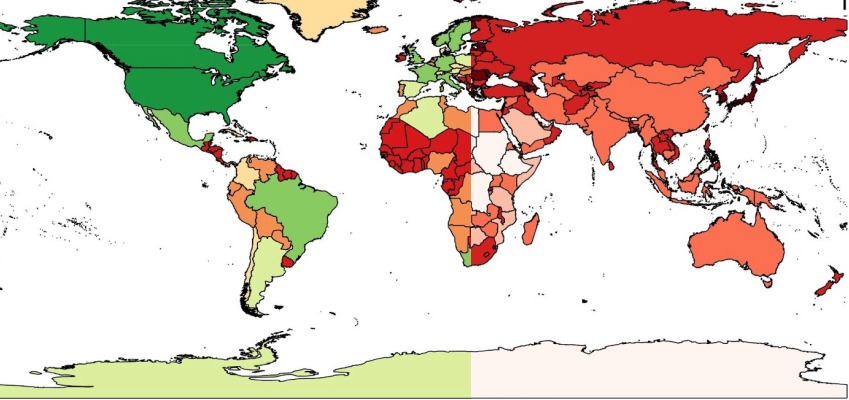
4. To obtain the density field in the attribute table click ‘editor tool’ and choose ‘field calculator’ tool. A dialog box opens in which type the ‘output field name’ as ‘DENSITY’.
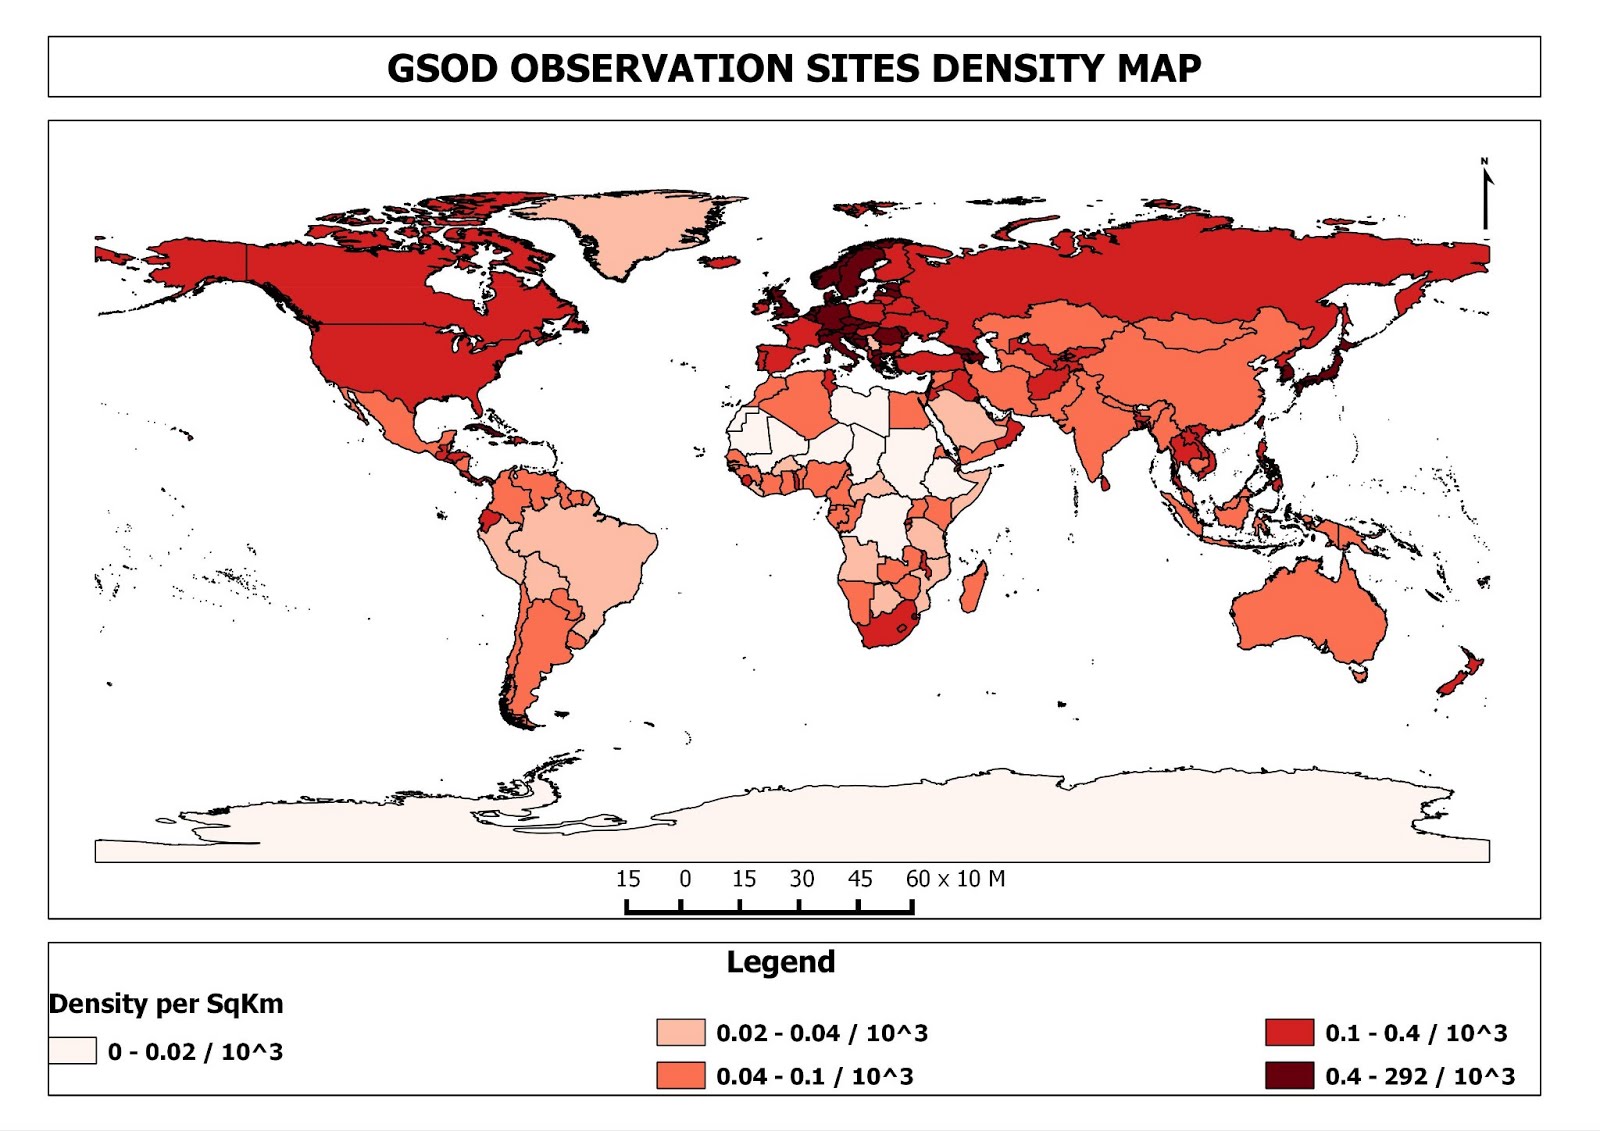
The density map was a useful guide to understand if we had enough data points in a country of interest. For our project work we select the observation sites which are in close proximity to the study area.