Image Planner Application for Mapping of Agricultural Areas
Introduction and Need For Image Planning
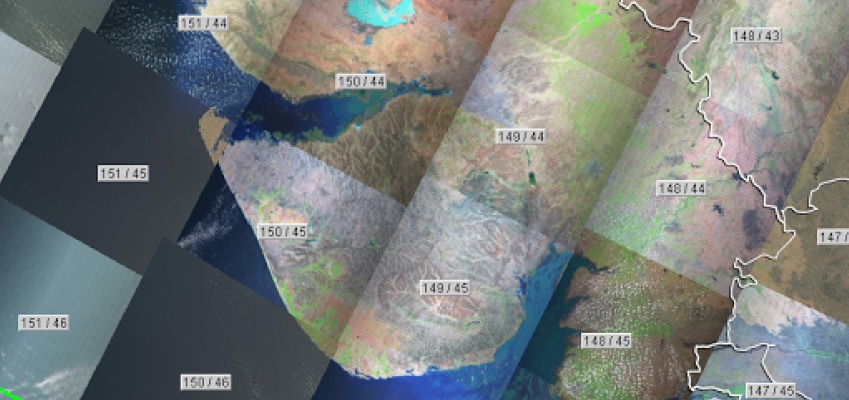
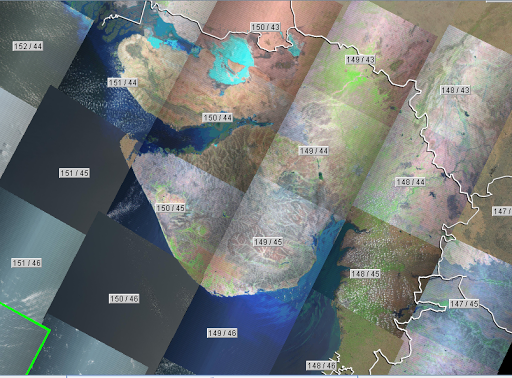
Initially we had planned to map the Agricultural areas of Gujarat and the major problem faced by us was to find the images of particular Season and Year. Gujarat State (Area – 196,024 km²) is covered by 17 Landsat Scenes, and Tile sizes being approximately 170/183 Km with cloud cover from 0 % -100 %. Due to the fact that lot of images with cloud cover of over 1% and loss of data for certain path and rows, all adding to the difficulty in classifying the images. Without the basic knowledge of image availability for particular season it was very hard to make a decision and also our time and data usage got beyond limit (Approximately Landsat MSS, TM and ETM data is around 150 Mb and Landsat OLI data is around 800 Mb). It was very hard to Plan for just a state with 17 Path and Rows. So, just think of more than 1 state. This application not only saves our time but also Cost since both are directly related.
|
S.No |
Sensor |
Spatial Resolution(m) |
No. Of Bands |
Scene Size (Km) |
|
1. |
Landsat MSS |
60 |
4 |
170/185 |
|
2. |
Landsat TM |
30/120 |
7 |
170/183 |
|
3. |
Landsat ETM |
30/15 |
8 |
170/183 |
|
4. |
Landsat OLI |
30/15/100 |
11 |
170/183 |
Therefore we were in need to make an image plan to find the appropriate imageries for appropriate seasons. Finally to make the image planning easy we had to design an application which gives an enhanced idea to make perfect decisions. Which will give you an outline for Several Projects like Crop Yield Estimation, Disaster Management, Urban Planning, Land use/Land cover Mapping, Watershed Management, Run-off Estimation, Morphometric Analysis, Sediment Yield etc…
Landsat data
Landsat data is one of the free satellite imagery provided by United States Geological Survey. The Landsat program offers the longest continuous global record of the Earth’s surface, it delivers visually stunning and scientifically valuable images of our planet. These data archive gives scientist the ability to assess changes in Earth’s landscape. Landsat sensors have a moderate spatial-resolution. You cannot see individual houses on a Landsat image, but you can see large man-made objects such as highways. This is an important spatial resolution because it is coarse enough for global coverage, yet detailed enough to characterize human-scale processes such as urban growth, Crop Yield Estimation, Disaster Management, Urban Planning, Land use/Land Cover , etc…
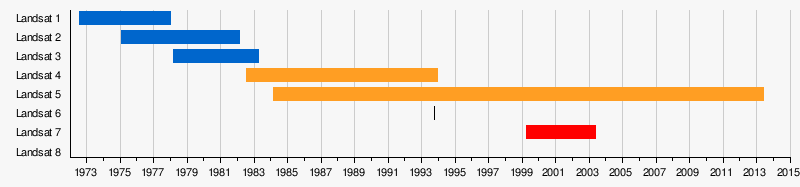
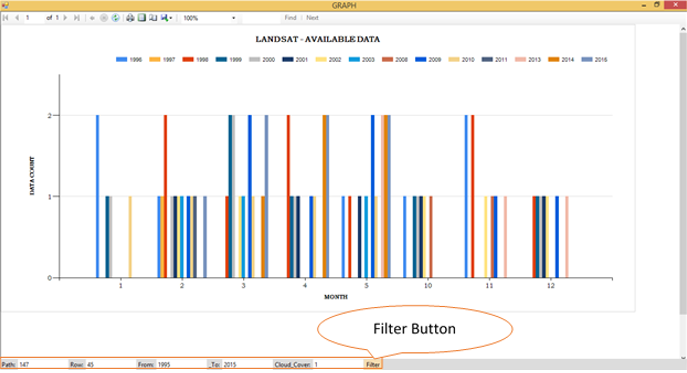
This Graph Shows the Landsat Time Series
Image Planning Application
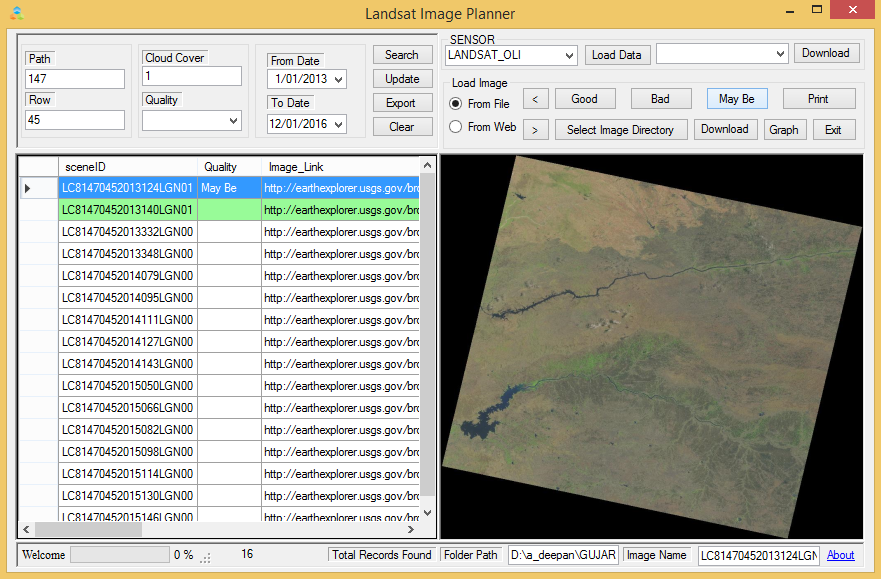
Image Planning application consists of several features where we can enter the Quality Manually based on our needs, classifying it as either Good, Bad or May Be based on the Image preview of certain Sensor, Path, Row, Year and Cloud Cover. The Database can be updated so that the application will never be out of Date.
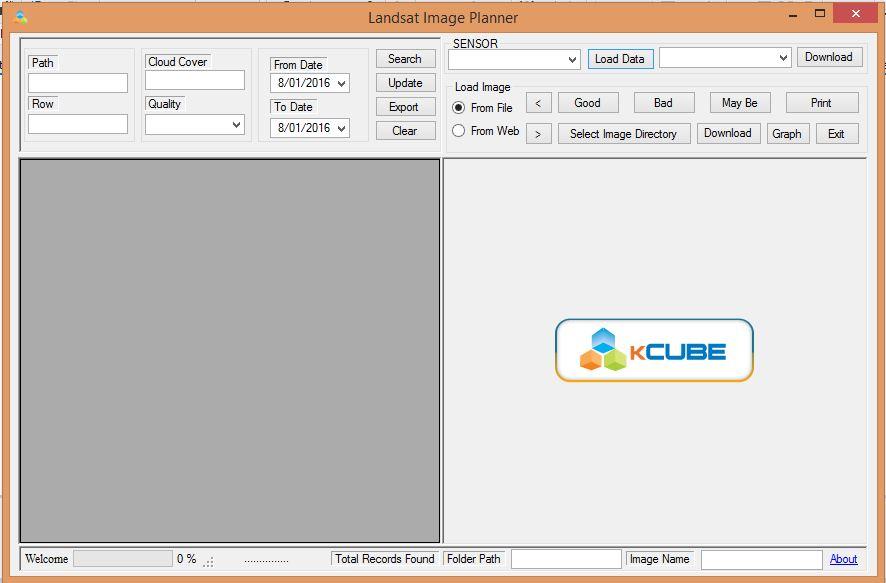
Main Window of the Image Planner
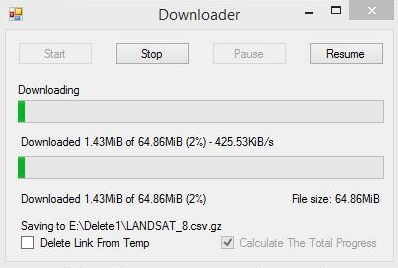
- Using this Download Option we can Download the Metadata (Landsat Sensors) and Import it into the database. These Metadata files are updated daily by USGS.
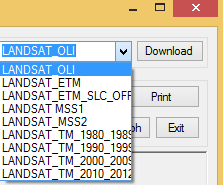
-
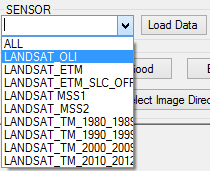
Using This Load Data option we can load the data into the Application
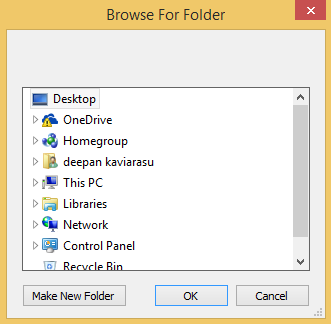
- It allows us to locate the folder which contains the Images For Preview
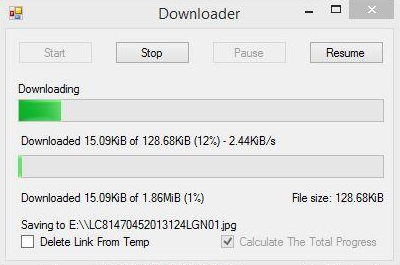
- If the preview Image is not available in the selected folder it allows us to download the Images and save it in the selected folder.
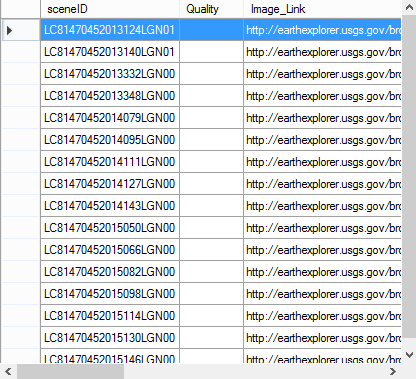
- The Table is loaded with the metadata and it consists of columns like Scene ID, Quality, Image Link, Day, Month, Year, Path, Row and Cloud Cover.
-
The selected image preview gets loaded in the application for manual verification (Cloud Coverage is manually seen and the Quality Column is updated as either Good, Bad or May Be). The image Quality is entered in the Quality column through a single click.
-
If there is a need, we can generate a Graph which shows the availability of data according to our query which makes it quite easy to understand. Here we can save the graph as Excel, Pdf and in Word Format so that we can analyze the Graphs for the needed Path and Rows with image quality which could help in determining the set of archived images to be chosen based on the nature of the project.