Microinsurance Map
- Home
- Case Study
- Microinsurance Map
Snap Shots

Microinsurance Map
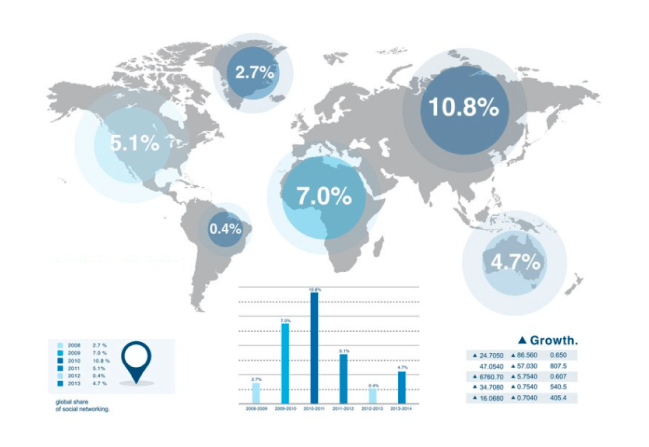
The weather insurance market is still in a nascent stage. The market players are practically working blind which is one of the reasons why the market is still operating so inefficiently. The Micro Insurance market has a huge data base spread across the country that yet needs a tool to analyze and dig meaningful information out of it. The development of the portal and the tools primarily is an attempt to portray present market conditions in the form of graphs and to illuminate the market-risk map of a region using GIS.
This portal at its minimum acts as a tool to introduce market players to better technology and technicians.
Client
The customer is one of the leading research organizations in the field of Insurance and Risk Management. The organization was set up under India’s most prestigious business school and academic institution upon the specific initiative of the Social Initiatives Group of a well known market player aimed at developing product development capabilities for insurance and other risk mitigating instruments designed to reach out to the poorest of the poor. The organization collaborates with the stakeholders namely, Insurers, NGOs and the Regulators to develop insurance programmes and build an enabling environment in the country to ensure outreach and efficient delivery.
Challenge
Since complete market data will never be available, the database needed to be designed intelligently to handle sporadic nature of the data.
Creating differentiated charts and displaying thematic maps joining various spatial and non spatial tables were also the technological challenges in the project.
Solution
We provided an open source WebGIS solution using GeoServer, JAVA and PostGIS. The front end was completely developed using Ext JS a rich JavaScript User Interface library that gives any user a desktop interface feeling.
The following are the salient features of the portal
- Generate Business / Outreach Report.
- Generate Claims Report.
- View Products, Definitions and Links.
- View Regional Crop Profile.
- View Region Meteorological Profile.
- View Regional Market Information.
- View Block level finer details.
- Know service providers’ penetrations on the map.
Benefits
The portal is now one stop for all information related to Micro insurance industry using which the market players are able to generate user friendly reports and charts and efficiently portray the market conditions. The mapping component enables various market players to assess the risk for crops by various regions.
Client
Theresa Dasilva
Project Value
$679
Date
June 14, 2022
Category
XD Design